As the economy appears to be weakening and the S&P 500 is at an all-time high, it is useful to see how the different sectors within the index have performed since the last downturn. This becomes even more relevant when considering that the S&P 500 appears to be overvalued compared to the real economy, as I've already explored in another analysis.
Historically, the best performing sectors will be the ones to suffer the most: Technology in 2002 and Real Estate and Financials in 2008. As usual, there will be a myriad of fundamental factors that investors will try to use to justify why those sectors have performed so well. This does not change the fact that, because of the mathematical realities of how we measure financial metrics, everything will tend to mean revert in the long run.
Sector performance
Using data from S&P, it is possible to see how the different sectors have performed since 2009.
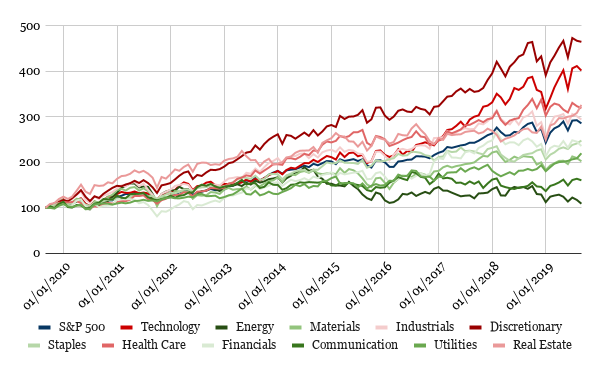
It is easy to see how two sectors have outshone all others: Technology and Consumer Discretionary. These are, by nature, cyclical business segments and should be expected to perform better than the market during prolonged periods of expansion. However, by this same logic, they would also be expected to take a significant hit during periods of economic slowdown.
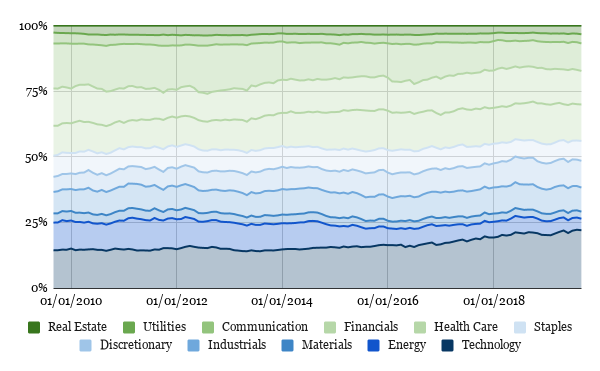
These two sectors have increased significantly as a proportion of the S&P 500 in the last 10 years. Consumer Discretionary is still a relatively small portion of the index, currently accounting for around 10% of its value. However, this is still a remarkable increase, when compared to its weight of 6.4% 10 years ago. Technology is now the most represented sector in the index, accounting for 20% of its total value. This compares to 16% 10 years ago. This is quite remarkable, especially when considering that a lot of companies that we consider "tech giants", such as Google and Facebook, are actually classed in the Communication Services sector.
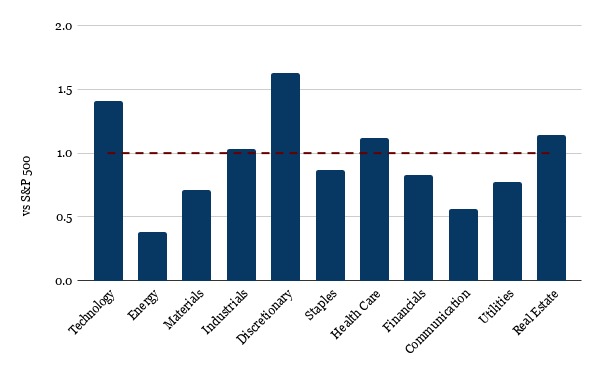
The chart below compares the performance of each sector to the S&P 500. It shows that the two best performing sectors had a return 1.4x and 1.6x greater than the main index, over the period.
The chart below compares the performance of each sector to the S&P 500. It shows that the two best performing sectors had a return 1.4x and 1.6x greater than the main index, over the period.

A possible indication that the Technology and Consumer Discretionary sectors might be overvalued can be seen by looking at the standard deviation and beta of each sector, compared to the broader S&P 500. In actual fact, these two sectors experienced moderate levels of volatility and a beta of around 1. Looking at these metrics, it is unclear how the returns of 15% and 16% a year would be justified, when the broader market experienced returns of 11% a year, with a similar level of volatility.
Interestingly, the sectors that currently appear to be the least overvalued are Energy, Utilities, Materials and Communication Services. This last one is particularly surprising, as it contains a mix of varied stocks (e.g. EA, Twitter, Google, Comcast, etc.), some of which should be heavily cyclical. On the other hand, Utilities are a non-cyclical sector and are expected to be among the weakest performing during a period of economic expansion, with low volatility and beta.
What is quite interesting is that these sectors have actually performed in line with GDP, indicating that, broadly speaking, they should be relatively fairly valued and, therefore, more resilient during a market correction.

Having established this much, I then looked at the sectors in more detail. For my analysis I focused on Consumer Discretionary and Technology, as they appeared overvalued and Communication Services, as it appeared out of place.
Consumer Discretionary
The first sector to consider is Consumer Discretionary. The chart below compares the performance of the 10 largest companies in this area against both the sector and broader index.

It is immediately clear how the two drivers of performance in this sector are Amazon and Booking.
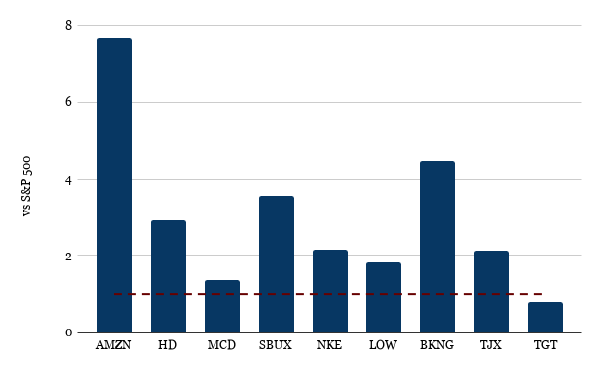
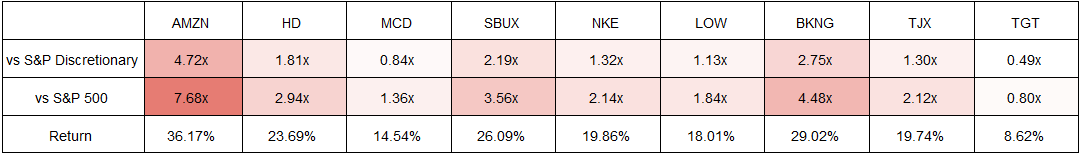
Amazon in particular, had an average return of 36% per year, almost 8 times greater than the index. Independently of fundamental factors, this is not sustainable in the long run. A similar issue is true for Booking, which experienced an average return of 29%.
Interestingly, both of these stocks are heavily focused on technology. Looking at the broader sector, we can see that at least three other companies within the Consumer Discretionary space have a significant link to technology: eBay, Expedia and TripAdvisor.
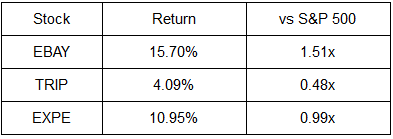
However, their performance is a lot more reasonable and in line with the broader market.
Of the 10 largest companies in this sector, only Target, Lowe’s and MacDonald’s, definitely more traditional and established companies, appear to have experienced reasonable return levels, broadly in line with the wider market.
Of the 10 largest companies in this sector, only Target, Lowe’s and MacDonald’s, definitely more traditional and established companies, appear to have experienced reasonable return levels, broadly in line with the wider market.
Technology
A significant number of stocks associated to this sector have performed extremely well over the past decade. Mastercard, salesforce.com, Visa, Adobe and Apple all had extremely high return levels, ranging from 24% to 30% a year.
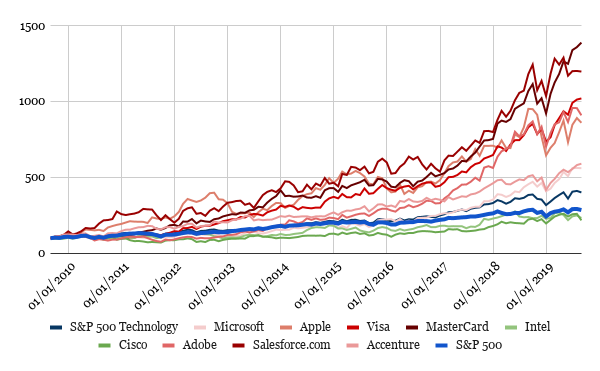
Even companies with lower return levels significantly outperformed the market, with Microsoft and Accenture showing returns of around 19%.

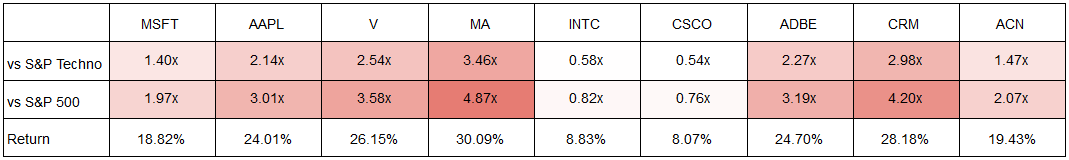
The only two stocks that have performed somewhat reasonably are Cisco and Intel, both in line with the broader market.
It is clear that these return levels are not sustainable in the long run and investors should expect at least a slowdown, if not a correction, in this sector. What is also surprising about this is that these are almost all mature companies with an established history. It is unclear why such return premia to the wider market would be justified.
Communication Services
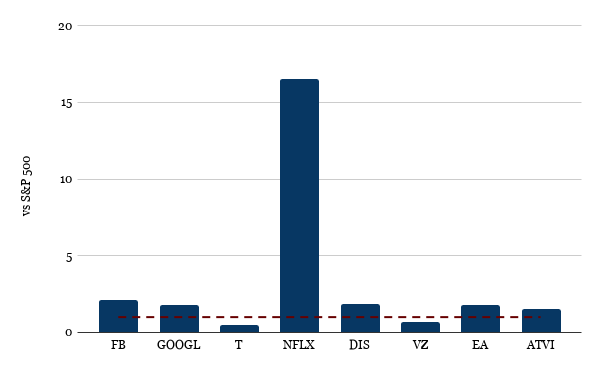
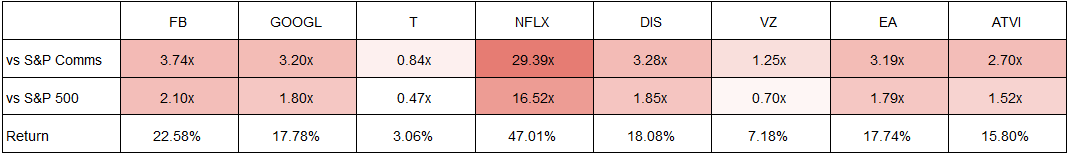
This is a particularly interesting sector, as it contains a mix of stocks with very different characteristics. We have companies like Google and Facebook, which are clearly technology focused. Netflix, EA and Activision should instead behave more similarly to Consumer Discretionary stocks. Finally, we also have more traditional stocks like Verizon and AT&T, which should be less volatile.
Given this mix, it is odd to see this sector performing so poorly.
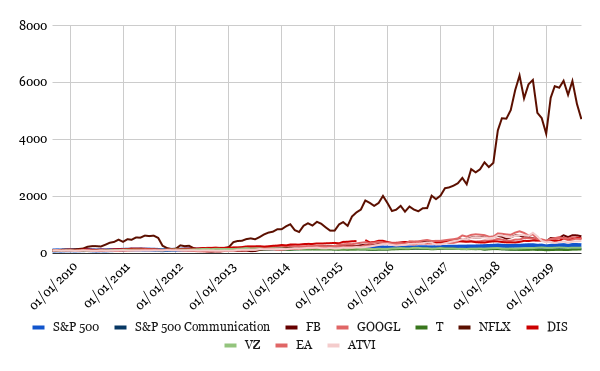
Looking at the performance against the S&P 500, not much can be seen, other than the fact that Netflix has substantially outperformed any other stock in this space. Analysing the same chart without Netflix, we can see that, as expected, the performance in this sector was very diverse.
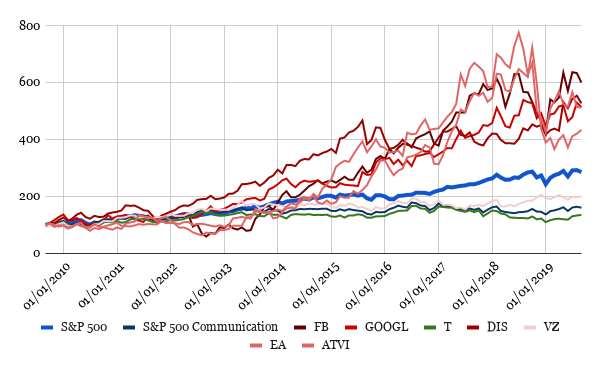
Tech-focused companies like Facebook and Google mirrored the performance of other Technology stocks. On the other hand, more traditional stocks like Verizon and AT&T performed more in line with Utilities.
Given this, not much can be said on how safe this sector would be during a correction. Stocks of more traditional service providers, like Verizon, Comcast and AT&T should definitely perform better. However, a large proportion of cyclical stocks makes this a potentially volatile sector.
Contribution to S&P 500
Having identified Technology and Consumer Discretionary as the two sectors that have appreciated the most in the last 10 years, it is useful to look at how the S&P 500 would have performed excluding them.
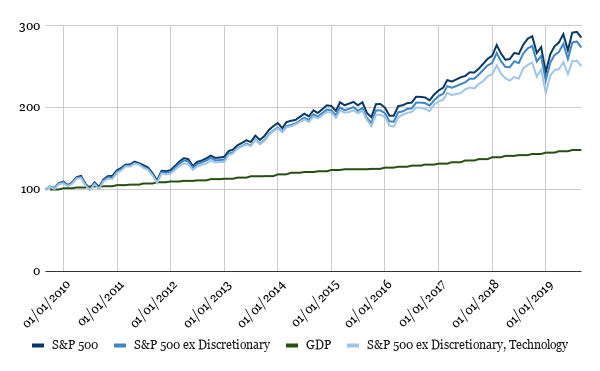

The chart and table above show that their contribution to the overall index performance was actually quite marginal. Without the two of them, the annual return of the S&P 500 would have declined by around 1.4%, from 11% to 9.6%.
Interestingly, when comparing the S&P 500 to GDP, even excluding these two sectors would keep the index at an overvalued level of around 40%.
This is not really a surprise, as most sectors have performed relatively similarly to the S&P 500. In addition, a large number of technology-focused stocks, which seem to have performed significantly above average in the past 10 years, find themselves in different sectors, therefore skewing somewhat the analysis. It should also be noted that the four sectors that had the lowest average return over the period only account for around 20% of the index value - less than Technology alone.
Conclusion
The two sectors that had the highest average return since the financial crisis are Consumer Discretionary and Technology. These experienced a performance significantly superior to the other sectors within the S&P 500 and some of the stocks found here grew at a rate of around 30% per year, which is clearly not sustainable in the long run. In addition, the levels of volatility of these two sectors were broadly in line with the wider market and do not seem to justify such return premia.
On the other hand, the sectors that appear to be better valued are Energy, Utilities, Materials and Communication Services. However, care should be taken when looking at these stocks. Whereas we would expect Utilities to be here, things are more complicated for the other sectors. Communication Services includes a range of different stocks, some quite cyclical (e.g. EA, Activision) and some more defensive (e.g. AT&T). This makes it unclear how it would behave during a correction.
Bearing in mind that the S&P 500 has recently grown at a significantly higher pace when compared to the broader economy, a correction should be expected. Historically, the best performing sectors are the ones experiencing the largest corrections. In light of this, investors should probably evaluate their role in their portfolios.
Written by Davide Buccheri
Copyright Davide Buccheri 2019
Comments
Post a Comment