The European Central Bank is arguably the second most powerful central bank on the planet after the Fed. As such, its impact on the world economy should be substantial. However, the ECB has often struggled to reach its objectives. These failures have pushed it to adopt some unorthodox monetary policies whose effects in the long run are yet to be seen.
Here, I look at some interesting data, which suggests that the ECB possibly never had the economy under its control and was just a passenger all along.
Targeting Inflation
The main objective of the ECB monetary policy is to keep a stable rate of inflation of around 2%. Looking at the historical CPI in the Eurozone, the ECB arguably failed in this objective in the past, with inflation closer to 1% and on a relatively stable downtrend.

A more interesting way of looking at inflation and monetary policy is to analyse the implied inflation of inflation-linked treasury bonds and see how this changed when policy rates were altered. To achieve this, I compared the yields on iBunds with their nominal counterparts and extracted the estimates of inflation embedded in their prices.
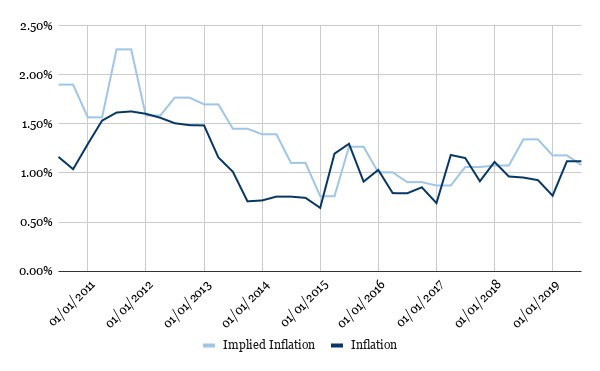
It is interesting to see how, since 2009, implied inflation has closely mirrored real CPI. The two are nowhere near the 2% target of the ECB, showing that markets might not have too much faith in the ability of the central bank to push inflation higher.
In addition, when highlighting policy rate changes, we can see how these had little to no effect on both actual and implied inflation rates. This further supports the idea that the ECB was broadly unable to influence inflation or investors.
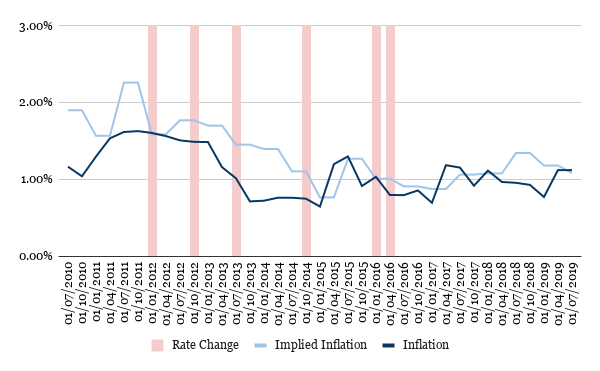
This is a concerning sign, as it indicates that none of the extreme measures put forward by the ECB are actually being successful. And investors are fully aware of this, expecting inflation to stay around the 1% level for the foreseeable future.
With this in mind, it is time to try to understand why this might be the case.
Money multiplier
The main way in which monetary policy affects the real economy is through the so-called money multiplier. This is a measure of how much money the banking system is able to create, for every unit provided by the central bank.
In order to approximate this, I computed the ratio of M3 to M1 money for the Eurozone. The results are quite astounding: the money multiplier has been in a steep decline since the mid 90s.
In order to approximate this, I computed the ratio of M3 to M1 money for the Eurozone. The results are quite astounding: the money multiplier has been in a steep decline since the mid 90s.
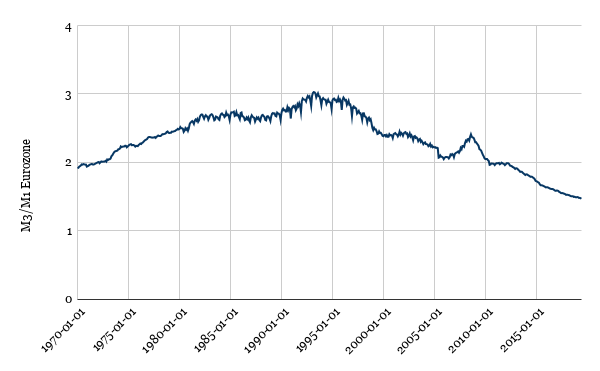
This means that the ability of the ECB to affect the economy has been diminishing steadily for the past 25 years.
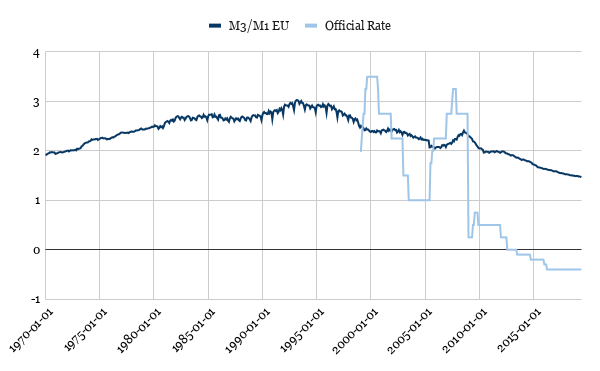
Interestingly, there seems to be a very strong correlation between the level of interest rates and the strength of the multiplier. The lower the interest rates are, the less effective monetary policy will be. This is quite problematic. To start with, it puts into question the ability of the ECB to respond to a future economic slowdown or recession. In addition, it also indicates that the ECB will need larger and larger rate cuts to pursue its objectives, which will in turn further erode its ability to act in the future.
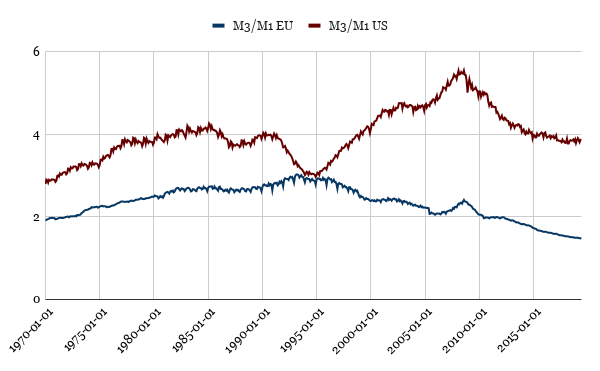
For comparison, the chart below compares the M3/M1 ratio for the Eurozone with the US. Even though the ratio has been in decline for both economies, It is clear how at this stage the Fed still has a much better control of the economy, at least when compared to the ECB.
Fiscal policy
The headaches for the ECB don’t end here, however. How effective monetary policy will be ultimately depends on its interactions with fiscal policy.
The chart below was compiled using data from the OECD and shows government deficit in Euros for each of the countries in the Eurozone in the 2009-2018 period.
The chart below was compiled using data from the OECD and shows government deficit in Euros for each of the countries in the Eurozone in the 2009-2018 period.
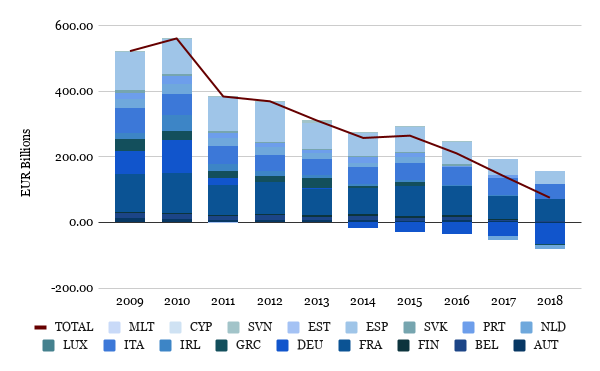
Total deficit for Eurozone countries has declined substantially in this period of time, falling by around 85%, from €522bn in 2009 to only €76bn in 2018. During this period of time we also had the collapse of inflation towards its current 1% level. This is probably not a coincidence.
To explore this further, I compared the percentage trend in M3 with government deficit. It is rather clear how this tight fiscal attitude has played an important role in watering down the already weaker effects of the ECB’s monetary policies.
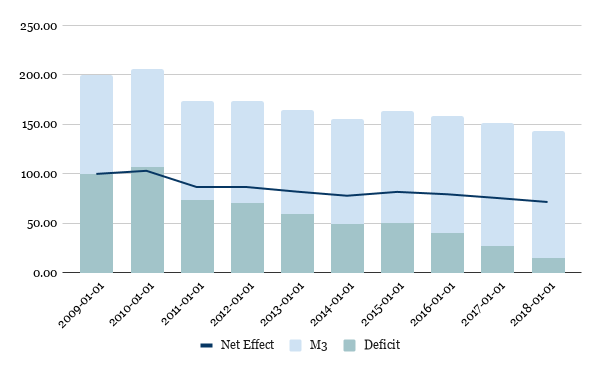
The chart shows how the decline in government deficit was substantially greater (in percentage terms) than the increase in M3: the ECB never stood a chance to improve the economy.
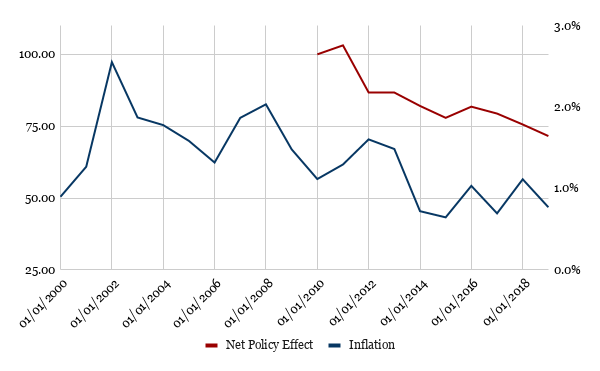
The chart below compares the net effect of these two policies with Eurozone inflation. It is rather clear that the two are following an almost identical downward trend, indicating that the inability of the ECB to affect inflation probably lies in an excessively restrictive fiscal policy, as European governments try to deal with their public debt.
The chart below shows that at least Eurozone governments were successful in reversing their debt-to-GDP ratios trend.

In actual fact, this restrictive fiscal policy did manage to bring the debt-to-GDP ratio of the Eurozone down somewhat, from a peak of 92% in 2015 to the current 85%. However, this is probably still not enough. For comparison, before the financial crisis of 2007 this value was at around 70%.
The trade-off is quite clear: if Eurozone governments relax their fiscal policy, they'll be unable to intervene in the economy should another recession hit. If they maintain it tight, they'll neutralise the effects of the ECB's intervention and erode its power.
During the financial crisis, it took a combined increase of debt-to-gdp of around 20% from governments and a 3% rate cut from the ECB to stabilise the economy. That was with a multiplier of around 2.3x. The current multiplier is at around 1.5x and declining, which means that the ECB would need at least a 4.5% rate cut to achieve the same impact on the economy, assuming no further declines in the multiplier. Given current interest rate levels, this is highly improbable. This leaves a greater burden on fiscal policy. Considering the current debt-to-gdp of the Eurozone, it is unclear whether governments will be able to cope with the resulting debt burden, assuming they'll be able to successfully intervene at all.
Conclusion
Repeated attempts by the ECB to bring inflation back to its 2% target have so far been unfruitful. This can be linked to two main factors currently at play: money multiplier and fiscal policy.
As for the former, the ability of the ECB to influence the economy has been steadily eroded for the past 25 years, as the multiplier has fallen dramatically. This seems to be attributable to the steep decline in rates that Europe has experienced for the past 3 decades. However, the effects of a similar decline in the US have been more limited.
Even then, not all would be lost with a bit of help from fiscal policy. However, Eurozone governments have been drowning in debt following the 2007 financial crisis and pursued a staunchly restrictive fiscal policy as a result. This has more than outweighed whatever effects ECB policies had on the economy, as shown by the rate of M3 growth against government deficit.
As rates decline, the ability of the ECB to further influence the economy will grow weaker and weaker. With high debt-to-gdp ratios and low money multipliers, it is unclear at this stage how the Eurozone would fare in another recession.
Written by Davide Buccheri
Copyright - Davide Buccheri 2019
Comments
Post a Comment